#90daysofdevOps-Day-74: Creating a dashboard using Grafana with integration of Loki and Promtail
Concept
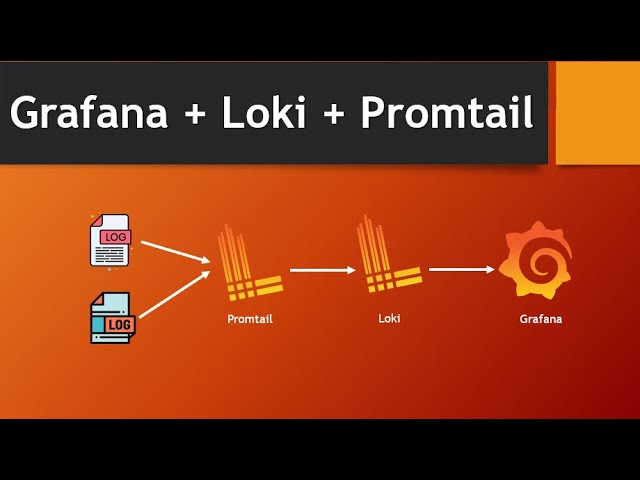
Loki and Promtail are agents connected to Grafana to achieve the dashboard creation.
Promtail is an agent which will ship the contents of local logs to a private Grafana Loki instance or Grafana Cloud. It is usually deployed to every machine that has applications needed to be monitored.

Pre-requisites
Install and configure Grafana in an EC2 instance.
Follow the below link to my blog which contains detailed steps explaining the installation process.
Let's Start with our Aim
Configure Loki and Promtail
Create a folder and download the yaml file that will contain the required configuration for running loki.
wget raw.githubusercontent.com/grafana/loki/v2.8.. -O loki-config.yaml

Download the yaml file that will contain the required configuration for running promtail.
wget raw.githubusercontent.com/grafana/loki/v2.8.. -O promtail-config.yaml

Run Loki Docker container using the below command.
docker run -d --name loki -v $(pwd):/mnt/config -p 3100:3100 grafana/loki:2.8.0 --config.file=/mnt/config/loki-config.yaml

In the above step, 3100 port is mapped to the loki container. Therefore let's open the port in the security group to make the loki container running.

Navigate to the loki URL and wait for sometime to make the loki live.


You can also see the metrics which means the logs which is the sole purpose of loki to collect.

Run the Promtail Docker container using the below command and check with docker ps to see the container status.
docker run -d --name promtail -v $(pwd):/mnt/config -v /var/log:/var/log --link loki grafana/promtail:2.8.0 --config.file=/mnt/config/promtail-config.yaml

Data Source in Grafana
Now, navigate to the Grafana webapp and on the homepage choose the add data source option.

Provide the HTTP URL as below to connect the loki data source to Grafana so that loki will send the logs to grafana.

Click on save & test to connect the data source.

Checking logs in Loki
Click on explore in the above screenshot after adding the data source. In the label filters, we can choose job and varlogs which is generally the path /var/log/*log in the backend to show all the system logs.

Click on the run query in the above screenshot to execute and show all the system logs as below.

Creating Dashboard
Let's add the log to the dashboard by choosing the option from the above screenshot location.

Now the system logs are added to the grafana dashboard. Let's add some more by clicking on visualization to add some graphs as shown below screenshot.

In Label filters choose job and varlogs and line contains to error to show all tthe lines with error and select the duration to show all the lines with error in the logs.

Similarly, let's check the error lines in grafana log that is placed in /var/log/grafana/grafana.log

To achieve the aim of displaying the grafana log, we need to provide the grafana log path to the promtail config yaml file in the target section as shown below.

We can now choose the label filters to set the job and grafanalogs with the line contains and visualization option to view in a graphical manner. We can add this to our dashboard.

Now, install nginx in the EC2 instance.

Use the proper label filters to show an aggregate sum of words repeating nginx while installing. This can be achieved by setting the varlogs as label filters.

We can see now the complete grafana dashboard.

